2.2.
The orthocentre locus
Let’s
revisit the
orthocentre locus we did in unit 12 to show how and why the
general quadratic equation is important and how it is useful.
- The
applet opens with Locus 1, the locus of the orthocentre P of DABC
with vertices
A(0, 0), B(a, b) and C(9, 0) as B moves along the
line y
= 7, or any line y
= k (you can change k). Drag or animate point B. Prove
that the locus is a parabola, and find its equation.
- Now
click Locus 2 and clear traces. What if the line is not horizontal, but
B moves along the line y
= x
+ 13, or any line y
= -x
+ k, k ³ 9 (you can change k). Drag
or animate point B. What kind of graph is the locus? Prove
your conjecture and find the equation of Locus 2.
- Now
click Locus 3 and clear traces. What if B moves along the line y = -x
+ 5, or any line passing between A and C (you can change k)? Drag
or animate point B. What kind of graph is the locus? Prove
your conjecture and find the equation of Locus 3.
|
|
Click here for
a discussion:  |
|
Open the Quadratic Equation applet and move
it so that you can see this text and work in the applet:

Use the
General Quadratic Equation applet to help you decide what
type of functions Locus 2 and Locus 3 are. Manually enter
the values for parameters a, b, c, …. we
found in the previous activity and press ENTER. Note the value
of the calculated discriminant …
|
|
|
Do you think that
Locus 2 is a parabola?
As we have often seen
before, and as Descartes emphasised, we cannot trust our senses, and especially
not our perception! It is not possible to identify a graph (function)
visually – different types of functions may look very similar
over small domains. Here again, we may be misled to think Locus 2 is
a parabola because we can only see a small portion of the graph.
It
may help to look at a larger domain, e.g. in this applet, we may see more of the graph of Locus 2. You can drag
or animate point R along the green line, which adapts the red line
and shows the orange locus for each position of R. You can at any
moment stop and drag or animate point B along the red line, with
orthocentre P tracing the locus.
|
|
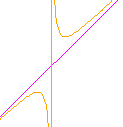
Do you notice
that as the red line gets close to C another part of the graph appears
at the top right? This clearly shows that the graph is not a parabola,
but a hyperbola with two arms, with the pink altitude and the extra
orange vertical line through as asymptotes.
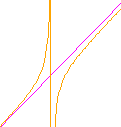
We
may easily have been misled to think that when the red line passes to the
right of C (Locus 2), the locus is a parabola, but when it passes
to the left of C (Locus 3) it is a hyperbola. Fact is, the locus
is a hyperbola for all these values! What happens at C, is simply that the hyperbola
changes orientation between the asymptotes. (Of course, exactly
at C, the locus is the pink line! Test it in the above applets
and prove it!)
The only
way to know for sure, is to work analytically, using algebra! |
  |
|
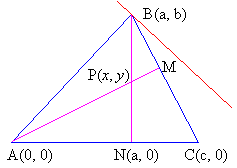
Let’s now handle the general situation:
Triangle
ABC has vertices A(0, 0), B(a, b) and C(c, 0). Let B
move on the line y
= mx
+ k, and let P(x,
y)
be a typical point of the locus of
the orthocentre of the triangle as B moves along the
line. Find the locus of P.

|
 |
|
|
|