4.
Goodness of fit
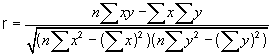
We now
know how to find the line of best fit. The important question is: How good
is the fit? We need a measure to say how good the fit is, i.e. to describe
how strong the relationship is.
Mathematicians use
the correlation coefficient as the standard measure of
the strength
of the linear relationship between two variables. Given
n data points (x1,
y1),
(x2,
y2),
... , (xn,
yn)
the correlation coefficient is given by the formula
It certainly is not necessary for us or our learners
to be able to calculate the value of r by hand. We can use technology
tools like Excel and graphing calculators to calculate it. But it is essential
that we understand the correlation coefficient at a conceptual level,
and are able to interpret it in analysing regression models!
From
scatterplot to best line
Open the Best line
applet below and move it so that you can work in the applet and read here
simultaneously. You
can plot points
in the applet by clicking your mouse … The applet automatically
draws the straight line that best fits your points, the so called "least
squares regression line", and also calculates the equation of
the line and its correlation coefficient r.

- Plot one point
and click Show Line. Why do you think a line is not graphed?
- CLEAR the graph
and plot two points that have whole number coordinates. Use
your own method to find the equation of the line through these two points.
Then click Show Line …
With 2 points, the line is an exact fit. So r = 1 or r = -1
no matter what the gradient of the line.
Check this statement in two ways:
Plot 2 points and click Show Line, then Clear, plot
2 other points and check its equation and r, Clear, then 2
other points, etc., every time noting the values of r and the gradient.
Is their a relationship?
Plot any two points and click Show Line. Then drag one of the
points (hold down SHIFT, grab the point with the mouse, then drag).
Drag the point in a circle around the canvass. How does r and the gradient
of the line change? Is the one dependent on the other? Describe: when
is r = 1 and when is r = -1?
- Clear the graph.
We are now going to plot three points in two ways:
- Try to plot
the 3 points so that they lie in a straight line. Click Show
Line. Does the line pass through all three points? What is
r and what is m? Then plot 3 different points in a line –
what is r and what is m?
- Plot any 3
points not in a straight line and click Show Line. Do you
think that the line fits the points well? Now drag one of the points
around … What happens to the line and the values of r and
m? Is there a relationship between the points, the line, r and m?
- Clear the graph
and plot several points. Click Show Line – do
you think that this line and it’s equation is a good representation
of the points?
Plot some more points and see what happens. Describe any patterns or
trends that you see.
Grab a point and drag it around. Observe how the regression line, its
equation and the value of r change. Describe any patterns that you see.
The
influence of one more point
Open the One point applet showing the regression line (line of best fit) for four points, and
the equation of the line and its correlation coefficient:

You can add one point
by clicking the mouse button in the applet …
Investigate the effect of such one extra point on the equation of the
best line and the correlation coefficient by adding different points to the dataset:
What is the influence
of points close to the existing line?
What is the influence
of points far from the existing line (outliers)?
Correlation
The correlation coefficient
always takes a value between -1 and 1, with 1 or -1 indicating perfect
correlation (all points would lie along a straight line in this case).
A positive correlation indicates a positive association between the variables
(increasing values in one variable correspond to increasing values is
the other variable), while a negative correlation indicates a negative
association between the variables (increasing values is one variable correspond
to decreasing values in the other variable). A correlation value close
to 0 indicates no association between the variables.
The square of the
correlation coefficient, r2, is a useful value in linear regression
and is used by programmes like Excel instead of r. r2 represents
the fraction of the variation in one variable that may be explained by
the other variable. For example, if a regression model of weight vs. height
of people has a correlation of 0,8, it means that the observed weights
are 64% attributable to length (the longer, the heavier), while 36% of
the weights are not related to length, but to other factors, like diet,
exercise, etc.
Estimating
Correlation
Open the Estimating
correlation applet: 
Press the "New Plots" button. Four
scatterplots should appear. Your challenge is to match the plots with
the correlations at the bottom left. Choose which plot you think goes
with each correlation, then press "Answers" to see the answers.
Each time you click "New Plots", the applet will generate new
values ...
|