03Green2.gif
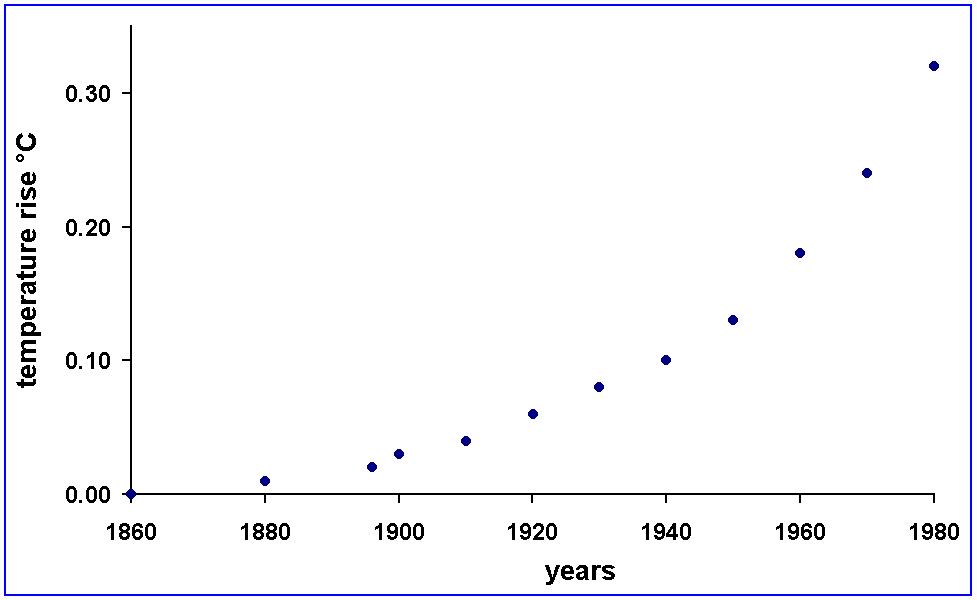
| Year | Temperature rise (°C) | 
|
| 0 | 0 | |
| 20 | 0.01 | |
| 36 | 0.02 | |
| 40 | 0.03 | |
| 50 | 0.04 | |
| 60 | 0.06 | |
| 70 | 0.08 | |
| 80 | 0.1 | |
| 90 | 0.13 | |
| 100 | 0.18 | |
| 110 | 0.24 | |
| 120 | 0.32 |
Excel link
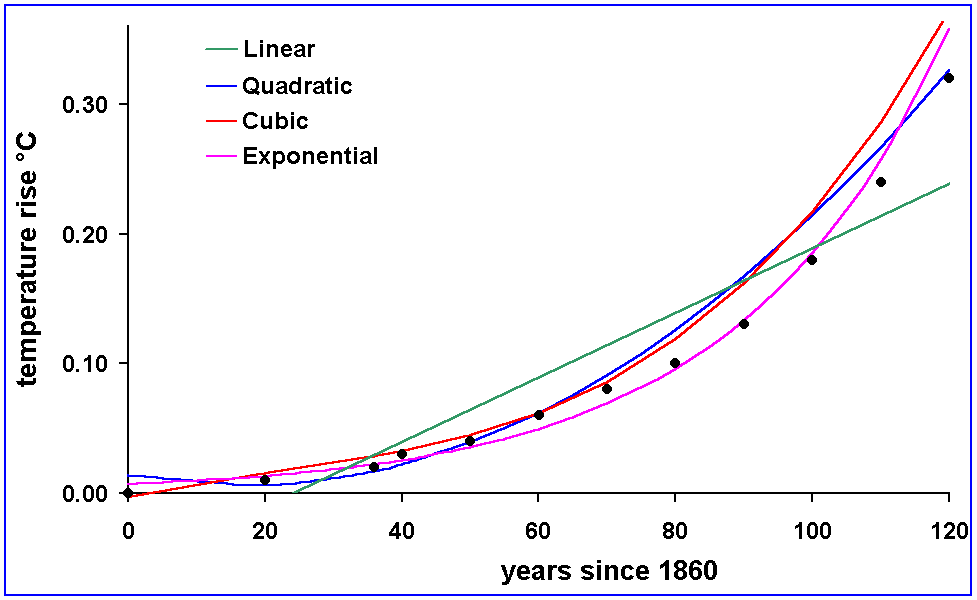
To see how you can use Excel to find such best fit approximate models, click here to go to Excel activity.
Excel should open in a new browser window. Here is an alternative link:
Greenhouse prediction
The graphs of the different approximate models are shown in this applet. To see how these different models predict the future differently, let's extrapolate the data: change the xmax to 220 and the ymax to 8 and press ENTER on the keybord, or click the Set Limits button ... Can you see from the graphs what temperature increase each model predicts by the year 2020 and by the year 2080? Which model do you think makes the best prediction?
Greenhouse prediction popup of above
The graphs of the different approximate models are shown in this applet. To see how these different models predict the future differently, let's extrapolate the data: change the xmax to 220 and the ymax to 8 and press ENTER on the keybord, or click the Set Limits button ... Can you see from the graphs what temperature increase each model predicts by the year 2020 and by the year 2080? Which model do you think makes the best prediction?
CALCULATOR prediction
CALCULATOR prediction popup of above
ICING CALCULATOR
Method 1: Numerically
Use the Surface Area Calculator below ....
ICING CALCULATOR popup of above
Method 1: Numerically
Click the button below to open the programmed Surface Area Calculator.
ICING
Method 2: Graphically
Use the graph below to find the value of x that will give the smallest Surface Area.
Click here for help on using the graph. WE- this is a working link!
ICING popup of above
Method 2: Graphically
Click the button below to open the Surface Area Graph. Use the graph to find the value of x that will give the smallest Surface Area. Click here for help on using the graph. WE- this is a working link!
Icing with calculus
Click to continue to next