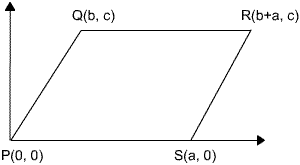
- Use
the cos-formula, which is a generalisation of the Theorem of Pythagoras!

- We can without
loss of generality place PQRS at the origin, with coordinates
as shown. So:
LHS = PR2 + QS2
= (b + a)2 + c2 + (b – a)2 + c2
= 2(a2 + b2 + c2) Similarly:
RHS = PQ2 + QR2 + RS2 + SP2
= (b2 + c2) + a2 + (b2 + c2) + a2
= 2(a2 + b2 + c2)

Vraag 3
- Kliek hier vir Excel oplossing.
-
Kliek hier vir Excel oplossing.
Note: Many student do not seem to understand the difference between, and the connections between the concepts domain, range, amplitude, period, phase and the concept of parameters, i.e. a, b, c and d in y = acos[b(x - c)] + d ...
If we can calculate or estimate the parameters, it will make the numeric calculation of the best-fit equation much easier!
a is the amplitude – e.g. for a simple harmonic motion, it is the maximum movement from rest. So a is half of the distance between the smallest and largest values:

So 4,35cos b(x – c) lies between -4,35 and 4,35 for all b and c. But the temperature graph lies between 12,5 and 21,2. So it is d that moves the graph up.
So: d = 21,2 – 12,5 = 12,5 – (-4,35) = 16,85b is the "speed" of movement, b determines how many cycles there are in one period.
The period of cos x is 360°, of cos 2x is 180°, of cos 3x is 120° …
So cos bx has a period of .
.
But we are working in radians, and the period of this year temperature is obviously 12!
So This will be the same
for any city!
This will be the same
for any city!y = cos (x – c) is the graph of cos x that moves c units right for c>0. But note that cos (2x – 60) does not move 60°, but 30°! So the graph of cos (bx – c) moves c/b units, but the graph of cos b(x – c) moves c units. So the form y = acos b(x .– c) is much more useful than y = acos (bx – c) …
We cannot calculate c exactly from the data – at best we can say that maybe (2; 21,2) is a turning point of the graph, which will mean that the graph has moved 2 units to the right, then c = 2. But the turning point is probably between x = 1 and 2, so c is between 1 and 2.


 Gebruik nou vir elke snypunt ZOOM en CALC intersect om die koordinate van die snypunte te bepaal: