
Also browse this webpage - the concepts are sound and it has good applications:
http://people.hofstra.edu/faculty/Stefan_Waner/trig/trigintro.html
Parametric equations
We are NOT working with circular motion, but with its components!
Of course we must understand the point P(x, y) on the circle with radius A is given by P(Acos q, Asin q). The ordered pairs (Acos q, Asin q) describe a circle, and going twice around the circle is good to define q + 360 = q.
But what we must understand is that cos q
describes the horizontal distance of P from (0,0) as q
changes.
So cos (q
) is a function in q
....
Likewise sin q
describes the vertical distance of P from (0,0.)
|
|
The horisontal distance covered by the point moving on the circle is the projection on to the x-axis. Now look at this projection:

 Our interpretation of this simple harmonic motion gives the possibility of many connections and new understandings. For example, for me, personally, the signs of sin q and cos q is "suddenly" intuitively as clear as daylight:
 It is this model that gives rise to our general function y = acos(bq+c), i.e. these phenomena are the reason for studying such functions!
If we have have graphing calculators available, we can experience this circular motion! The TI-83 screenshot below shows the graph of the two parametric functions
It is this model that gives rise to our general function y = acos(bq+c), i.e. these phenomena are the reason for studying such functions!
If we have have graphing calculators available, we can experience this circular motion! The TI-83 screenshot below shows the graph of the two parametric functions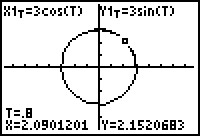 We can easily check that in
 Lets now experience this circular motion in the following Java applets.
The first example below is a circle defined by x(t) = rcos(t) and y(t) = rsin(t).
We have the added advantage that we can trace the curve ...
Note that the "time" interval runs from 0 to 2pi, i.e. one revolution and the "speed" (the number of intervals) is the same for all examples.
Click on the drop-down menu at the top and Trace to illustrate how the graph is influenced by
- amplitude (or vertical scaling), e.g. 5cos(t),
- period (or horisontal scaling), e.g. 10cos(5t),
- phase (or horisontal translation), e.g. 10cos(t+1), and
- vertical translation, e.g. 10cos(t)+5
The challenge is to see the connections between the diagram, its defining formulae, and the separate graphs of x(t) and y(t),
Challenge
The examples below are very interesting curves! Click Trace Curve! and watch the movement!
The movements may seem complicated, but, still, x(t) merely describes the projection of the movement of the point onto the X-axis and y(t) the movement onto the Y-axis, and we should be able to describe, graph and give the generating formula of this projection! For example, in the Connected hearts curve below, despite the complicated point movement, x(t) simply is a cosine function with amplitude 10, repeating 3 times in the time interval 0 to 2pi, so its formula is x(t) = 10cos(3t).
For each of the functions in the drop-down menu below, click on Trace Curve!, analyse the movement of the point carefully, then draw the graphs of x(t) and y(t) and give their defining formulae:
Need help or want to check your answers?
SOME ACTIVITIES:
SHM:. The PENDULUM and and a SPRING PENDULUM are examples of SIMPLE HARMONIC MOTION, where the distance, speed, ... vs time is modelled by functions of the form y = acos(bt+c). Take a close look at these very interesting interactive illustrations:IMPLICATIONS
All this, to my mind, says we should start with CO-ORDINATE definitions of the trigonometric functions, not with the triangle, which is a special case ..... I am not motivating it much, except to say that it is very difficult to generalise to the general case from the triangle. See this effort to try do it in a sound way:
http://www.ucl.ac.uk/Mathematics/geomath/trignb/trigmod.html
INTERACTIVE TOOLS FOR INVESTIGATION
There are many online applets showing interactive trigonometry concepts, you should really visit these sites and reflect on how it can be used:
http://www.ies.co.jp/math/java/trig/
http://www.bun.falkenberg.se/gymnasium/amnen/matte/trigapplets/trigfunc.html
http://mathinsite.bmth.ac.uk/html/applets.html
Here are three Excel activities I have quickly designed, trying to capture the same ideas:
Definitions
y=asinb(q - c) + d
y=acosb(q - c) + d
We can illustrate the functions with Geometer's Sketchpad (you need Geometer's Sketchpad to open it):
Trigonometric functions
Names and notations
I think we should help teachers to realise that NAMES and NOTATIONS do not come first.
In this case, like in all of mathematics, we study the relationship between variables (functions) and many times we are interested in things that are constant despite variation (e.g. direct proportion, the sum of the angles of a triangle, Pythatgoras, etc.). So here we have:
that something like y/x is constant despite the variance in y and x ...
This turns out to be a function of q
. We can/should in the beginning denote it, like other functions, as f(q
).
This is an interesting function, because although we do not have a "formula", and mathematicians for centuries did not have a formula, we can nevertheless find f(30) = 0,5, f(31) = 0,513, etc.
This function is so special that mathematicians gave it a special name, so we denote it sin(q
).
Only few functions are so special that they have special names. Another one is log(x).
I am pushing that we write sin(q
) and log(x) for a long time before changing to sin q
and log x!!!! I am not going to motivate it much, except to say that that is the historical development, and maybe it will help people understanding trigonometry as FUNCTIONS and stop such howlers as sin(A+B) = sin A + sin B !!